
How This Brand-New Tool Could Uncover the Next Big Small-Cap Surge (Before It Happens)

Markets feel jittery right now. Inflation readings are creeping up, and trade-war drumbeats are getting louder.
Already, the “Magnificent 7” mega-cap tech stocks have delivered stunning gains earlier this year. History shows that this is exactly the kind of backdrop where an “easy bar” dynamic can supercharge Big Tech once more. In other words, investor pessimism and lowered expectations could set the stage for another leg up in tech – but only if you know where to look.
Today felt like just another sideways session for the market. Stocks flatlined into the weekend – paralyzed by former President Trump’s renewed tariff threats against Europe, yet buoyed by a steady stream of upbeat tech and energy news. It’s a balancing act between political theater and technological progress, and so far, it’s a stalemate.
But there is a critical turning point occurring beneath the surface…
Trade War Noise vs. Seasonal Tailwinds for Tech
Let’s start with the headwinds.
President Donald Trump turned up the tariff talk again, this time demanding a minimum 15–20% tariff on all EU imports as part of any trade deal. He’s set an August 1 deadline, after which he’s threatened to slap 30% blanket tariffs on the entire bloc. Investors, naturally, are wary – such a broad tariff would be a body blow to global trade.
But here’s the thing: this is all bark and no bite.
We’ve seen this play out before, multiple times. The pattern is almost scripted: Trump talks tough; other countries squirm; backroom deals get struck; and the final tariffs end up at some face-saving but manageable level. In fact, some investors and economists have noted Trump’s habit of backing off his worst tariff threats after making headlines. The EU is urgently negotiating to avoid the August 1 barrage – they had been hoping for a U.K.-style deal with around a 10% baseline tariff and select exemptions. We still think we’ll land roughly in that 10% range by August – low enough not to break the economy, but high enough for Trump to claim a “win.” Deals will happen. This current drama is all part of the political theater.
When they do, the giant tech “Magnificent 7” will likely see a tailwind. Big Tech has seen their earnings expectations slashed in recent months, setting up an easy bar for upside surprises. As growth stocks faltered earlier this year, Wall Street aggressively cut estimates. Analysts lowered S&P 500 earnings forecasts by a larger margin than usual heading into Q2, and many cuts were concentrated in tech.
In fact, the combined EPS growth forecast for these seven tech titans has collapsed from roughly 20% to just the mid-teens year-over-year, based on recent analysis. This means the “expected” bar is now so low that positive surprises are highly likely.
For context, in early 2024 the Magnificent 7 were growing earnings over 50% while the rest of the S&P managed 1%; by Q1 2025 that gap shrank to 21% vs 8%, reflecting how estimates for the megacaps have come down. Now, even modest beats by Big Tech could ignite outsized stock moves across the markets.
Small-cap stocks, on the other hand, have been relative underachievers in recent weeks, and now stand to win big – notably, it’s happening almost exactly as the seasonality data predicted.
TradeSmith’s Seasonal Edge tool showed that small caps were likely to lag during the early summer, and indeed the Russell 2000 index’s performance has been muted lately (especially compared to the AI-driven surge in the Nasdaq earlier this year).
The good news?
That same tool indicates that small caps are poised to join the broader rally later in the fall when their bullish seasonal window opens up. Historically, smaller stocks often come to life in the late stages of an economic expansion or market rally – frequently in the October to December timeframe.
Last year was a perfect example: the Russell 2000 spiked over 20% between late October and late December 2023 when optimism over rate cuts and economic resilience sparked a furious catch-up rally. We’re expecting a similar scenario this year – a “surprise” small-cap surge that most of Wall Street will only recognize after it’s already underway. But with the right foresight (and tools), you can anticipate it before it happens.
Spotting Seasonal Breakouts: Datadog and Enovix
Now, let’s pivot to two concrete examples of how pinpointing seasonal patterns can uncover the next big surge – especially in lesser-known small and mid-cap stocks that don’t get the spotlight like the Magnificent 7.
Datadog (DDOG): A Seasonal Surge in Progress – Cloud monitoring software company Datadog might not be a household name, but it has been on our radar due to a powerful seasonal trend. According to the Seasonal Edge tool, DDOG entered a historically bullish window that runs through July 31.
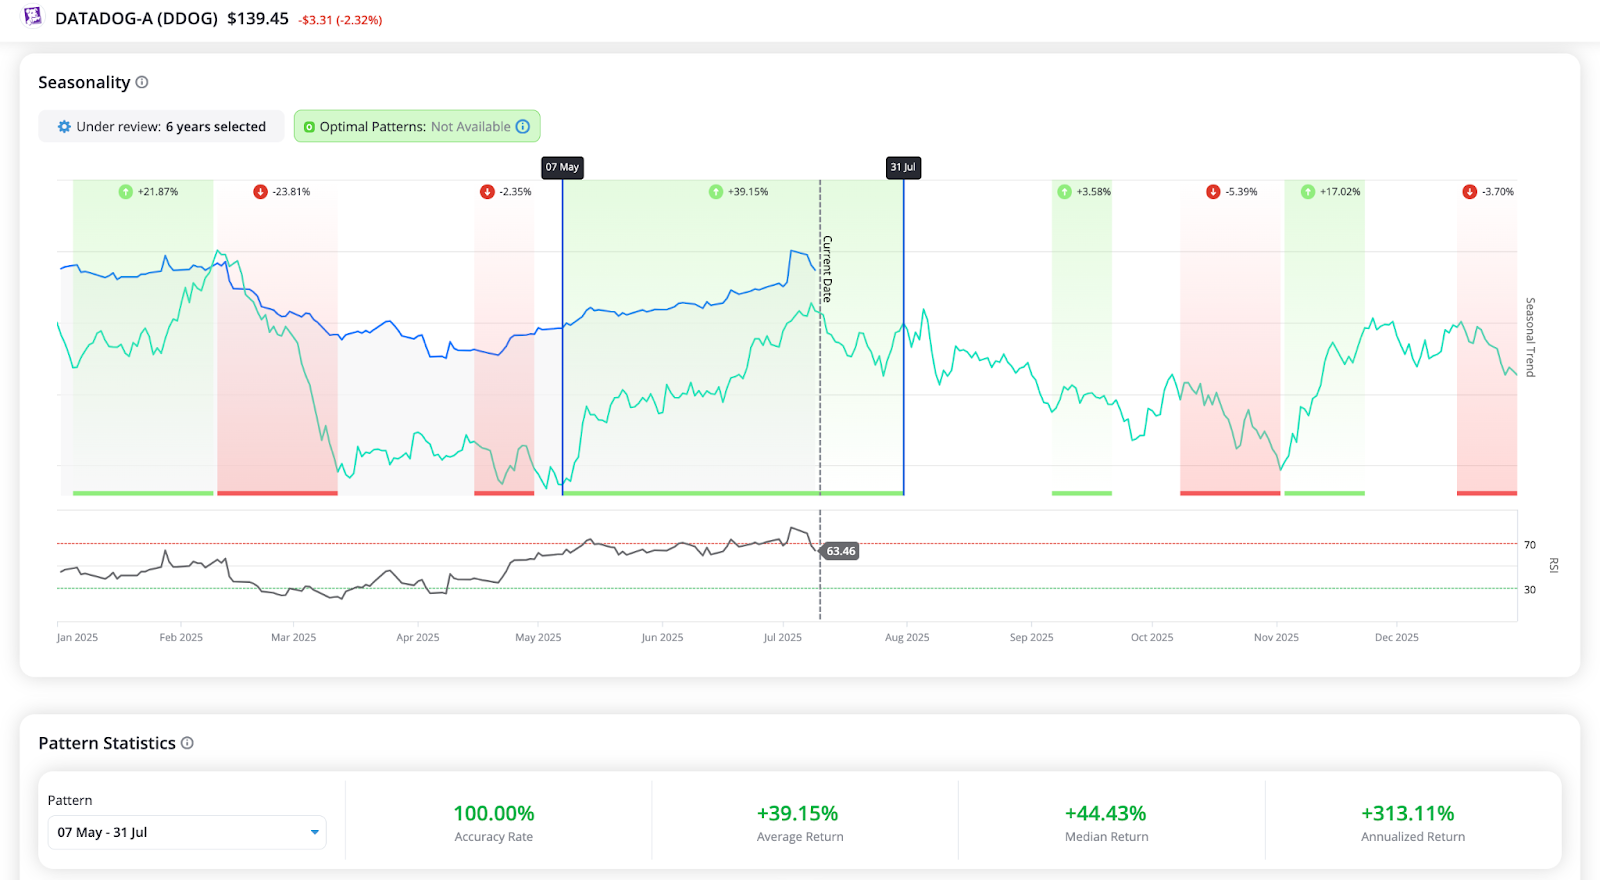
So far, it has gained about +35% since this window opened – an impressive move, yet still shy of its average seasonal return of +39% for this period in past years. In other words, Datadog’s typical summer rally isn’t done yet if this year follows the historical script. We could see a bit more upside into the end of July, potentially closing that gap to the ~39% average.
After that, the seasonality for Datadog turns tougher in the late summer (August through October tends to be a choppier time for the stock). However, if you look further out, DDOG is set to shine again in the late-year bullish season – it has an average return of roughly +17% during a strong stretch from early November to Thanksgiving (Nov 3 to Nov 23), again based on its historical trading patterns.
The key is that Datadog’s business (real-time data and AI-driven monitoring) is fundamentally solid, but the timing of when investors pile in tends to follow a seasonal cadence. Having insight into that cadence gives traders an edge in capturing the bulk of the move.
Enovix (ENVX): A Case Study in Seasonal Breakouts – We recently flagged battery-tech innovator Enovix to our Early Stage Investor subscribers as a “material mover,” and the Seasonal Edge data backed up our bullish stance.
Enovix presents a textbook example of a narrow, time-bound seasonal window with a historically reliable bullish bias – exactly the kind of pattern Seasonal Edge is built to identify. The chart below (from the Seasonal Edge tool) highlights Enovix’s performance from May 12 through July 11 over the past four years, and the statistics are eye-popping:
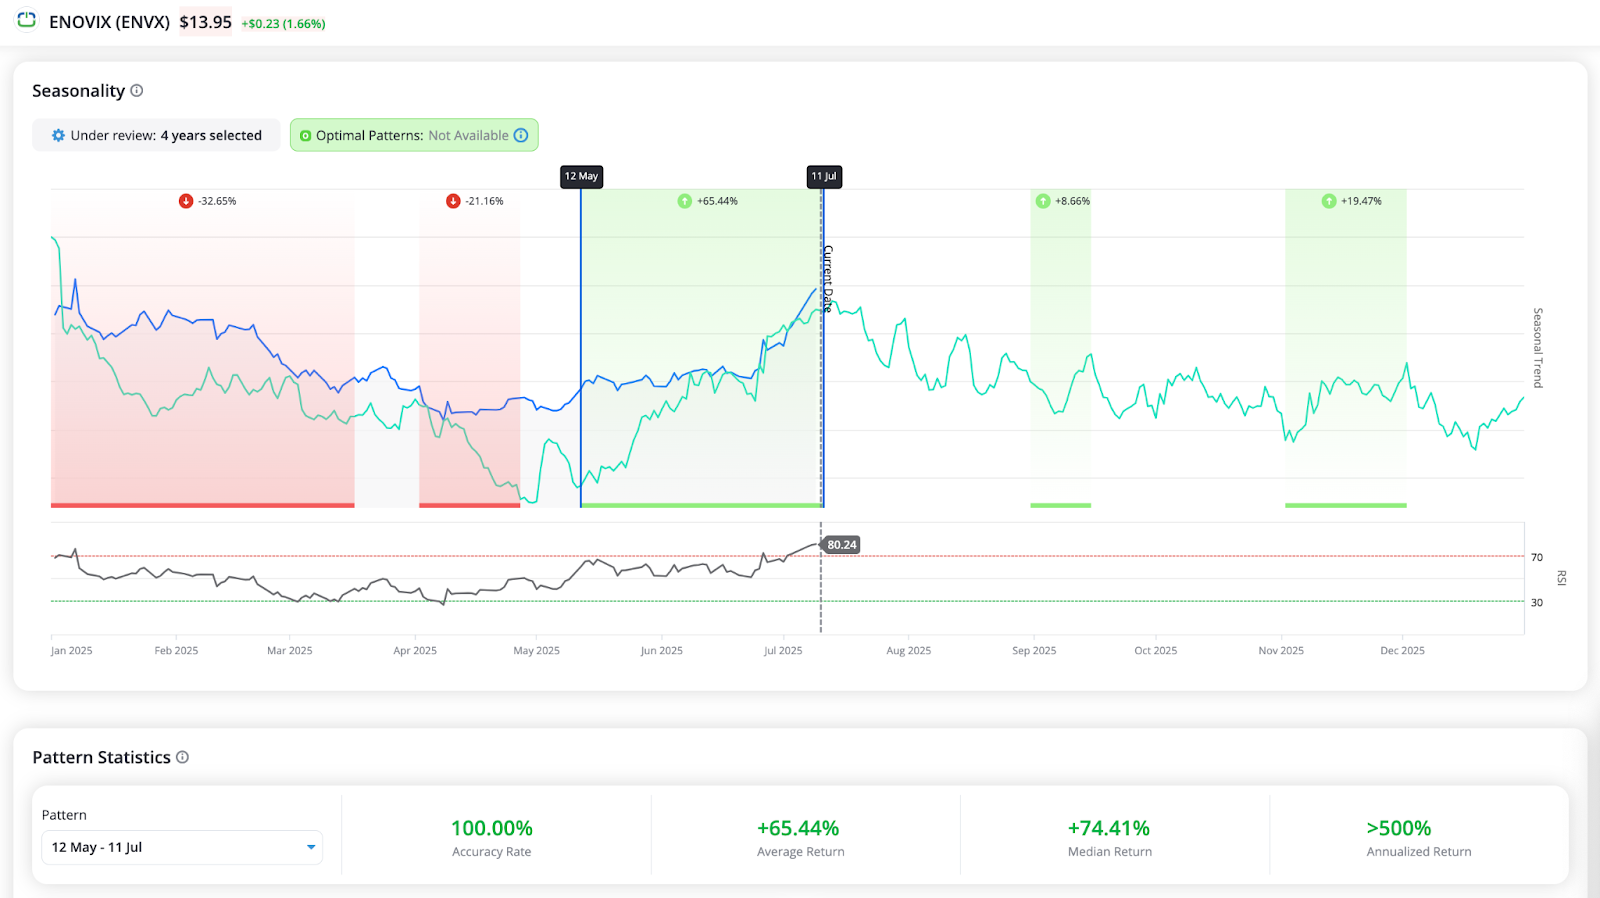
- 100% win rate: ENVX delivered a positive return in this May-to-July window every year for the past 4 years (2019–2022). In other words, in each of those years, the stock bottomed out in the spring and rallied into early summer.
- Average return: a whopping +65.44% gain during this roughly 8-week window.
- Median return: an even higher +74.41%, indicating the consistency skewed toward very large gains (one weaker year dragged the average down a bit, but typically the stock almost doubled in this period).
- Annualized return: If you extrapolate that 8-week return to a full year, it’s over 500% annualized – illustrating just how powerful the move is in that short span.
- It follows drawdowns: This explosive rally window usually comes on the heels of notable Q1/Q2 pullbacks (shown in red on the Seasonal chart). In each of the past four years, Enovix shares suffered a significant decline earlier in the year, bottomed out in mid-spring, and then rocketed higher starting in May. It’s a classic “turnaround” pattern – the stock bases out and then enters a seasonally strong period where positive news or momentum tends to hit.
- Overbought at the peak: As of July 11, 2025 (the end of this year’s window), Enovix’s RSI momentum indicator reached 82.2, firmly into overbought territory – consistent with a frenzied rally. (Indeed, ENVX surged more than +70% during this year’s window, right in line with the historical pattern.)
ENVX stock has reliably delivered outsized short-term returns in that specific mid-May to mid-July stretch. Knowing this in advance, an astute swing trader could have positioned accordingly, ridden the wave, and then taken profits as the stock became overbought by mid-July.
Notably, Enovix often consolidates or pulls back after this window – which fits with the RSI reading over 80 (a signal that a breather is due). Going forward, Enovix actually has another favorable seasonal period later in the year (alongside the broader market’s typical Q4 strength), so we’ll be watching for a potential second bite at the apple in the late fall. But the May–July move was clearly the big one, and it played out just as the Seasonal Edge analysis suggested it could.
This is precisely the kind of hidden opportunity that a tool like TradeSmith’s Seasonal Edge can uncover – a narrow time frame where a smaller stock like ENVX has a statistically significant bullish bias that isn’t obvious just from headlines or fundamentals.
By surfacing these patterns, the tool helps traders capitalize on edges that others simply don’t see. When you combine that with solid due diligence (in Enovix’s case, we had strong conviction in their fundamental story as well), you greatly stack the odds in your favor.
Bottom Line
Seasonality might sound like market folklore, but the numbers are real. Take Apple as an example: over the past 15 years, Apple’s stock has averaged a +12.4% return from June 10 to September 1 with a win rate of nearly 87%.
Nvidia, similarly, has enjoyed a “hot summer” on the back of AI enthusiasm – in the 15 years through 2022, NVDA shares gained an average of +10% between late May and end of August. The pattern is clear: these AI leaders often shine during specific seasonal windows.
However, most investors miss out on surges because they’re hard to pinpoint – especially if you can’t see the hidden pattern. That’s where having the right tool makes all the difference.
TradeSmith’s new Seasonal Edge tool lets everyday traders visualize these historical windows with precision, pinpointing the calendar “green days” where certain stocks statistically tend to outperform.
Using decades of price data, it highlights when a given stock or sector has reliably rallied (and when it has slumped) year after year. In short, it reveals the seasonal superpowers of stocks that many traders will never even know about.
On the date of publication, Luke Lango did not have (either directly or indirectly) any positions in the securities mentioned in this article.
P.S. You can stay up to speed with Luke’s latest market analysis by reading our Daily Notes! Check out the latest issue on your Innovation Investor or Early Stage Investor subscriber site.
The post How This Brand-New Tool Could Uncover the Next Big Small-Cap Surge (Before It Happens) appeared first on InvestorPlace.