How to Read a Stock Chart: A Beginner’s Guide to Crypto Analysis
Introduction: Understanding Stock Charts in the Crypto Space
Did you know that over 56% of cryptocurrency investors rely on technical analysis to make informed decisions? Yet, only a small fraction truly understand how to read a stock chart effectively. This can lead to missed opportunities in a rapidly evolving market. In this article, we’ll explore how to read a stock chart, with a focus on its application in digital currency trading and offer practical insights that anyone can grasp.
What is a Stock Chart?
A stock chart is a graphical representation of a security’s price over time and displays various crucial data points, including:
- Price movements – Shows how the price has changed over different time frames.
- Volume – Indicates how much of the asset was traded within a certain period.
- Market trends – Helps identify whether the market is bullish (rising) or bearish (falling).
In the context of digital currency trading, mastering stock charts can greatly enhance your strategy and decision-making process.

Types of Stock Charts
When learning how to read a stock chart, you will encounter several types. The three most common are:
- Line Charts:
- Simple and easy for beginners, they connect the closing prices over a period.
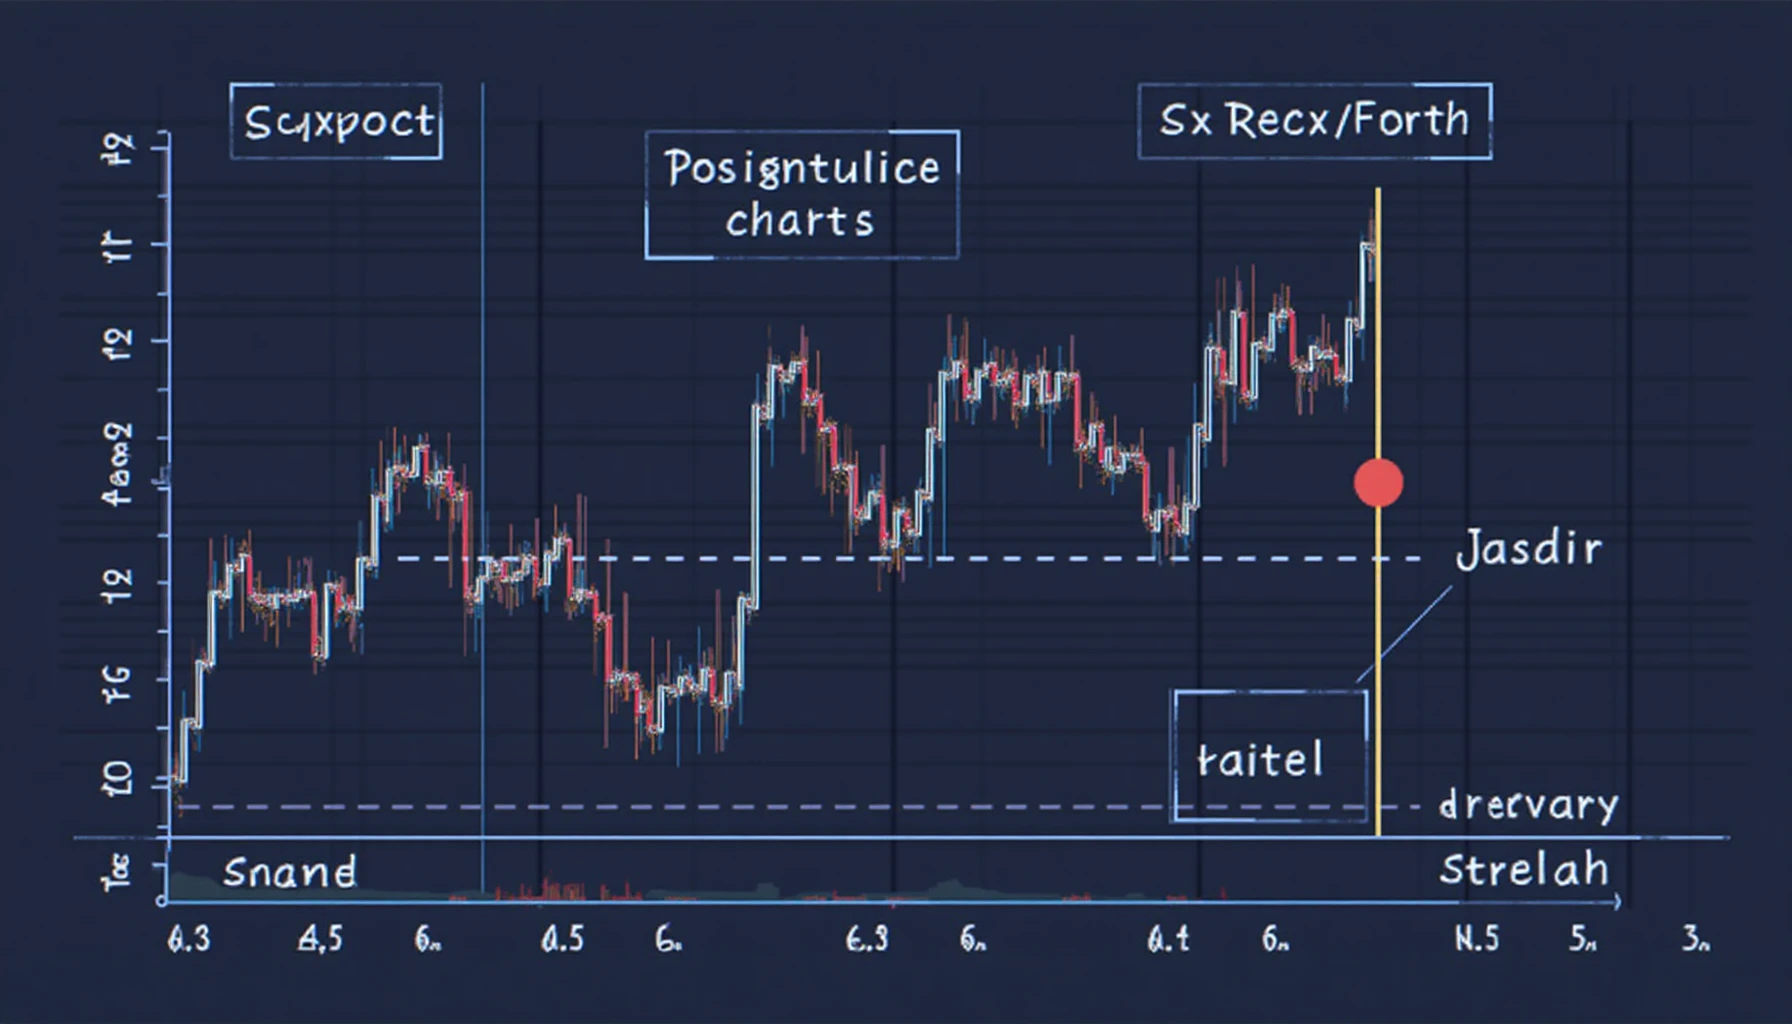
- Candlestick Charts:
- Provide more information, showing open, high, low, and close prices.
- Visual cues help identify possible trend reversals.
- Bar Charts:
- Similar to candlesticks but presented in a vertical line format.
For instance, if you’re interested in how to safely store cryptocurrencies, understanding candlestick charts can help you determine the right entry points when purchasing assets.
Key Elements of Stock Charts
As you dive deeper into how to read a stock chart, it’s crucial to familiarize yourself with a few key elements:
- Support and Resistance Levels: Identify where prices typically stop falling (support) and where they often reverse direction (resistance).
- Indicators: Use tools like Moving Averages (MA) and Relative Strength Index (RSI) to analyze momentum and potential price movements.
- Chart Patterns: Recognizing shapes like ‘head and shoulders’ or ‘double tops’ can provide insights into future movement.
For example, if the price of Bitcoin repeatedly tests a support level without breaking below, this can indicate a buying opportunity for new investors.
Conclusion: Ready to Start Trading?
Understanding how to read a stock chart is essential for anyone looking to excel in digital currency trading. By applying these simple techniques, you can better position yourself for successful investments. Remember, the crypto market is volatile, and it’s crucial to stay informed and practice due diligence.
Interested in taking the next step? Download our comprehensive cryptocurrency trading guide to learn more about securing your investments and making informed decisions.


